.svg)
.png)
Code Visualization: 4 Types of Diagrams and 5 Useful Tools

What Is Code Visualization?
Code visualization is the process of representing code in a graphical or pictorial format, rather than traditional lines of text. It entails creating visual representations of the structure, behavior, and evolution of software. Code visualization is about understanding the big picture of a codebase, seeing relationships and dependencies, and making sense of complex data structures.
Visualizing code can help bring clarity to complexity and make the abstract more tangible. When we visualize code, we are essentially translating the intricate language of computers into something more human and more comprehensible, both for developers and non-technical roles.
This is part of an extensive series of guides about [CI/CD].
In this article:
- Why Is It Important to Visualize Code?
- Using Diagrams for Code Visualization
• Architecture Diagrams
• Dependency Graphs
• UML Diagrams
• C4 Diagrams
Why Is It Important to Visualize Code?
Here are a few key benefits code visualization can provide for individual developers and development organizations:
- Identify and fix bugs more easily: Visual tools can highlight areas of the code where potential errors may lie. For instance, they can spotlight sections of the code that are unusually complex, which could signal potential bugs. Also, by visually tracing execution paths and data flows, it can be easier to find and fix bugs.
- Conceptualize large-scale projects: It's not uncommon to work on projects spanning thousands, if not millions, of lines of code. Code visualization can offer a bird's-eye view of the codebase, allowing developers to understand the overall structure and architecture of the software.
- Visualize dependencies: Code visualization can help visualize dependencies between modules or libraries. This can be particularly useful when making changes to the code or debugging, as it allows developers to anticipate the potential impact of their changes and take preventative measures.
- Onboard new software developers: Code visualization can help new developers understand the structure of the codebase, the relationships between different parts of the code, and where they need to focus their attention. This can significantly reduce the learning curve and allow new developers to become productive more quickly.
Using Diagrams for Code Visualization
One of the most effective ways to visualize code is through the use of diagrams. Diagrams provide a visual representation of the code's architecture, dependencies, and relationships, making it easier to grasp the overall structure of the system. Let's explore some commonly used diagrams for code visualization:
1. Architecture Diagrams
Architecture diagrams provide an overview of the system's structure and how its components interact with each other. They help us understand the high-level organization of the codebase and the flow of data and control between different modules.
These diagrams typically include components such as modules, classes, interfaces, and their relationships. By visualizing the architecture, we can identify areas of improvement, ensure proper separation of concerns, and make informed decisions about code organization.

2. Dependency Graphs
Dependency graphs are a powerful tool for visualizing the dependencies between different components of the codebase. They show how different modules or classes depend on each other, allowing us to identify potential issues such as circular dependencies or overly coupled code. By visualizing dependencies, we can make informed decisions about refactoring, identify areas of potential improvement, and ensure a modular and maintainable codebase.
3. UML Diagrams
Unified Modeling Language (UML) diagrams provide a standardized way of visualizing code. By using UML diagrams, we can communicate complex ideas and concepts in a standardized and easily understandable manner. Common types of UML diagrams include:
- Class diagrams: Show the relationship between classes, their attributes, and methods.
- Sequence diagrams: Illustrate the interaction between different objects over time. Activity diagrams: Help visualize the flow of control within a system.

4. C4 Diagrams
C4 diagrams are a relatively recent addition to the code visualization toolkit, designed to provide a multi-level, hierarchical representation of software architecture. These diagrams are broken down into four levels:
- Context Diagrams: Provide a bird's eye view of the system, showing how it interacts with users, external systems, and other software components.
- Container Diagrams: Visualize the high-level technology stack and how major parts of the system communicate with each other.
- Component Diagrams: This level illustrates the internal structure of individual containers, showing how various components within a container interact.
- Code Diagrams: Represents the actual code structure, including classes and interfaces, along with their relationships.

Source: Wikimedia
Learn more in our detailed guides to:
Key Features and Capabilities of Code Visualization Tools
While it is possible to create code visualizations manually, many developers use dedicated code visualization tools, or visualization features of their integrated development environment (IDE). These tools provide useful features that can make code visualizations easier to create and more effective.
Syntax Highlighting
Syntax highlighting displays text, especially source code, in different colors and fonts according to the category of terms. This feature can make reading code easier and less error-prone, as it enables developers to quickly identify syntactic elements like keywords, variables, or function calls.
Syntax highlighting can also aid in spotting syntax errors. For instance, if a variable is not highlighted in the expected color, it may indicate that it has not been correctly declared or initialized. This feature, while seemingly simple, can be a major time-saver in coding and debugging.
Dependency Mapping
Understanding dependencies is essential for effective software development. Dependency mapping visually represents these relationships, helping developers understand how different parts of the code interact with each other.
With dependency mapping, developers can see at a glance which parts of the code depend on a particular module or function. This can inform decisions about code changes and help anticipate potential ripple effects. It can also aid in identifying areas of the code that may be overly complex or tightly coupled, signaling areas for potential refactoring.
Interactive Debugging
Interactive debugging features enable developers to step through the code execution one line at a time, watch the state of variables, and visually trace the execution path. This can provide invaluable insights into how the code behaves at runtime and help identify and fix bugs more efficiently.
Interactive debugging can also serve as a powerful learning tool. By visually stepping through the code, developers can gain a deeper understanding of how different programming constructs work, how data structures evolve over time, and how algorithms unfold.
Heatmaps
Heatmaps are a visually intuitive method of displaying complex data. In the context of code visualization, heatmaps can be used to show various aspects of your codebase, such as the frequency of code changes, code complexity, or the number of bugs in different parts of the code. By using colors to represent these different metrics, heatmaps allow you to quickly identify hotspots in your codebase that may need attention.
Collaborative Features
Many code visualization tools provide collaborative capabilities, allowing multiple developers to work on the same codebase simultaneously, annotating and discussing the code in real time. This can greatly enhance team collaboration and communication, making it easier to identify and resolve potential issues early in the development process.
Integration with IDEs and Repositories
Finally, many code visualization tools integrate seamlessly with popular integrated development environments (IDEs) and code repositories. This integration allows you to visualize your code directly within your preferred coding environment, making it easier to understand and navigate your codebase. As mentioned, popular IDEs also include built-in code visualization tools.
5 Notable Code Visualization Tools
CodeSee
CodeSee is a dynamic code visualization tool that integrates seamlessly with development workflows and tools, including GitHub. It offers an array of features designed to provide deep insights into codebases, making it easier for developers and teams to understand, navigate, and manage their software projects effectively.

Key features include:
- Automatic codebase mapping: Automatically generates a map of the codebase, displaying connections between services, directories, and files.
- Visual review process: Maps changes in pull requests for better understanding and context of code changes.
- Interactive code tours: Features interactive, visual code tours to communicate ideas and code paths effectively.
- Feature planning and ownership maps: Provides tools for visualizing feature architecture and designating code ownership within a team.
- Side-by-side code comparison: Aids in comparing different versions of code and logically groups code for improved comprehension.
- Dependency identification: Helps in identifying and understanding dependencies in the codebase.
Learn more about the CodeSee platform
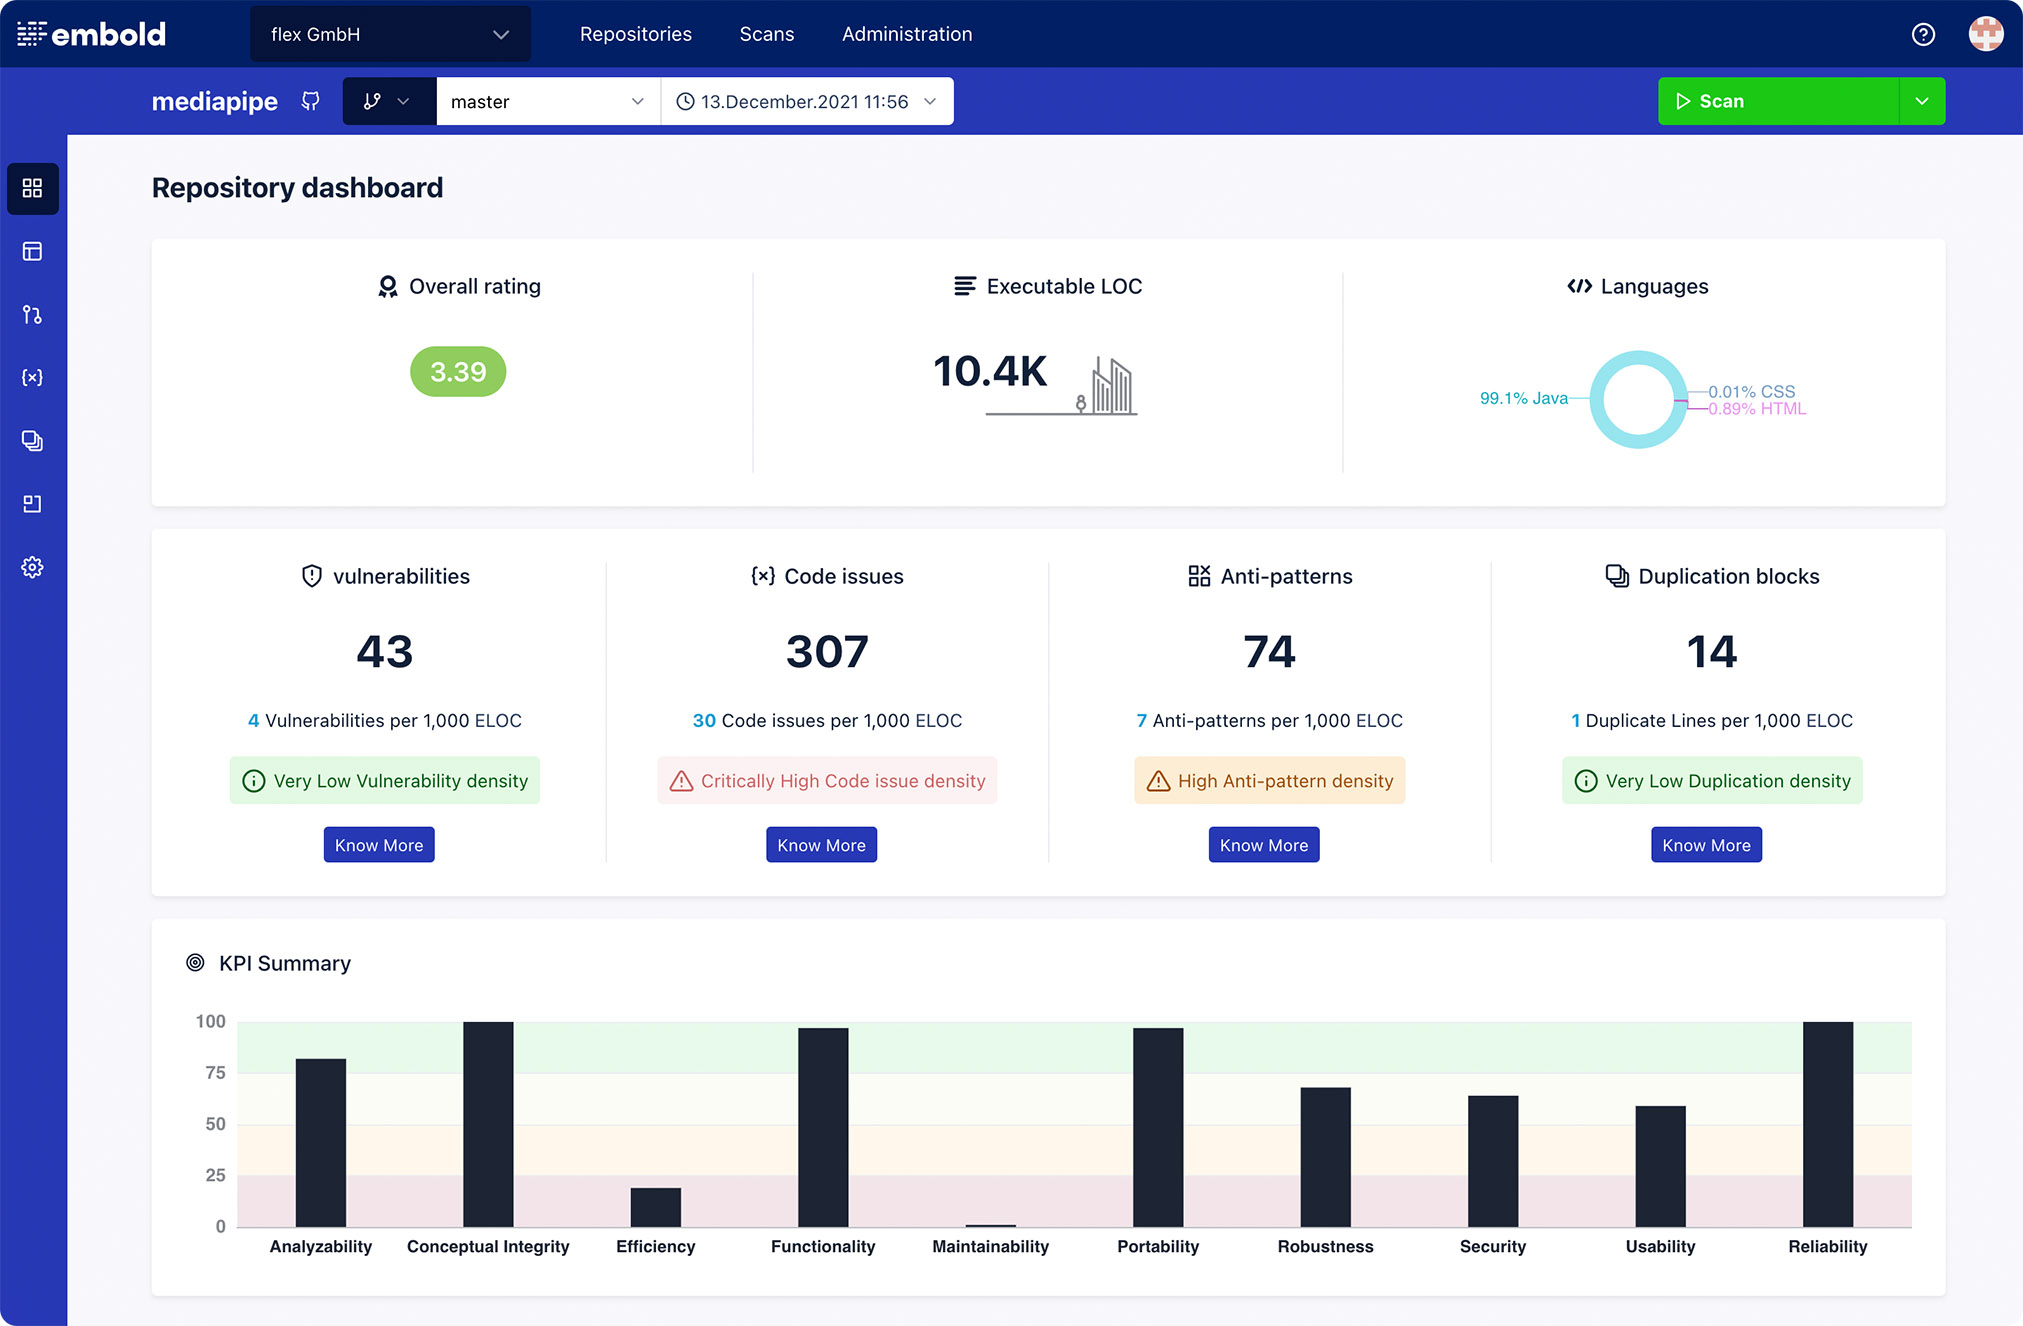
Embold

Embold is a developer tool that helps with code analysis, visualization, and refactoring. It helps developers understand their code's structure and quality, pinpoint potential problems, and refactor the code to enhance its maintainability and robustness.

Main features include:
- Code maps: You can create interactive displays of your source code, highlighting the relations and dependencies within your codebase.
- UML diagrams: Automatically create UML (Unified Modeling Language) diagrams, such as class and sequence diagrams.
- Graphs and charts: Create graphs that present various metrics like code complexity, test coverage, and code replication.
- Code heatmaps: Create heat maps that indicate sections of the code with the most usage or potential quality issues.
Gource
Gource is an open source tool that generates visualizations of codebases based on version control data.
Main features include:
- File tree visualization: Generates a tree-like visualization of the codebase, with each file represented as a node in the tree. The tree grows and changes to reflect the addition and modification of files.
- Customization: Allows users to customize the visualization in various ways, such as by specifying which types of files or events to include or exclude.
- Color coding: Uses different colors to represent different types of files or events, such as new files (green), modified files (yellow), and deleted files (red).
- Branching and merging: Shows the relationship between different branches and when they are merged together.
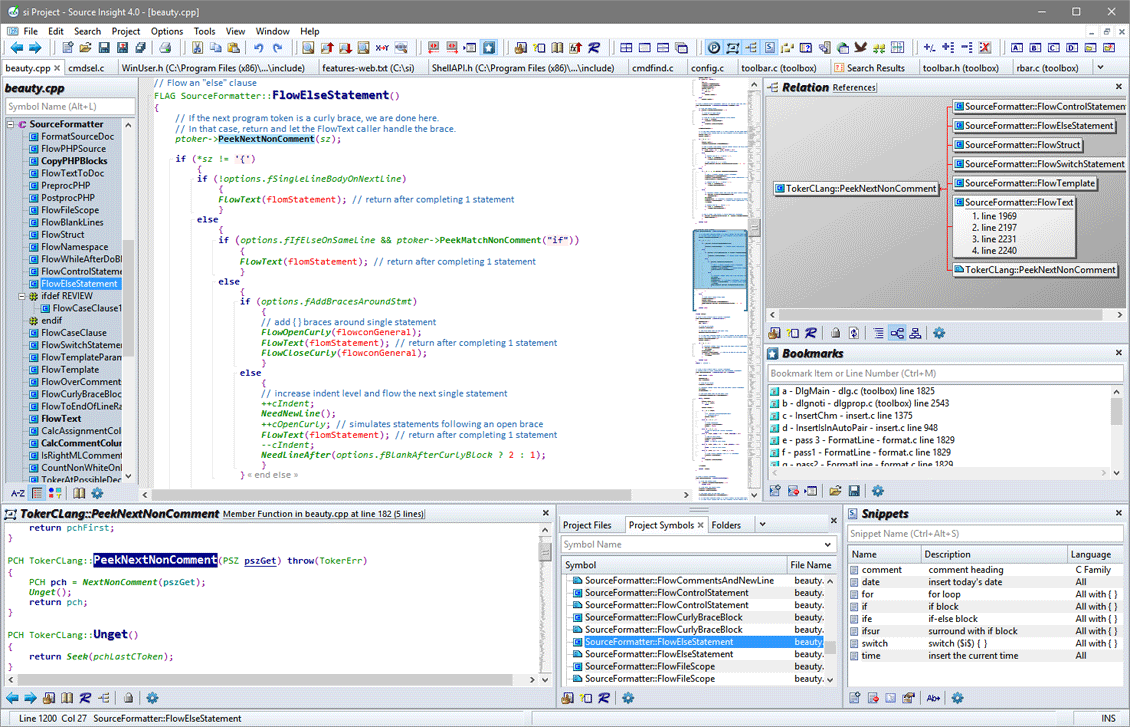
SourceInsight

Source Insight is a code editor and source code analysis tool developed by Source Dynamics. It is designed to help developers navigate, analyze, and understand large codebases.

Main features include:
- Syntax highlighting: Provides syntax highlighting for a variety of programming languages, which makes it easier to read and understand code.
- Code browsing: Allows developers to easily navigate through a codebase by displaying a list of variables, functions, and classes and their locations in the code.
- Cross-reference analysis: Allows developers to see how different parts of the codebase are interconnected and how they depend on each other.
- Interactive code maps: Creates interactive graphical maps of code relationships, which can be used to understand the structure and dependencies within a codebase.
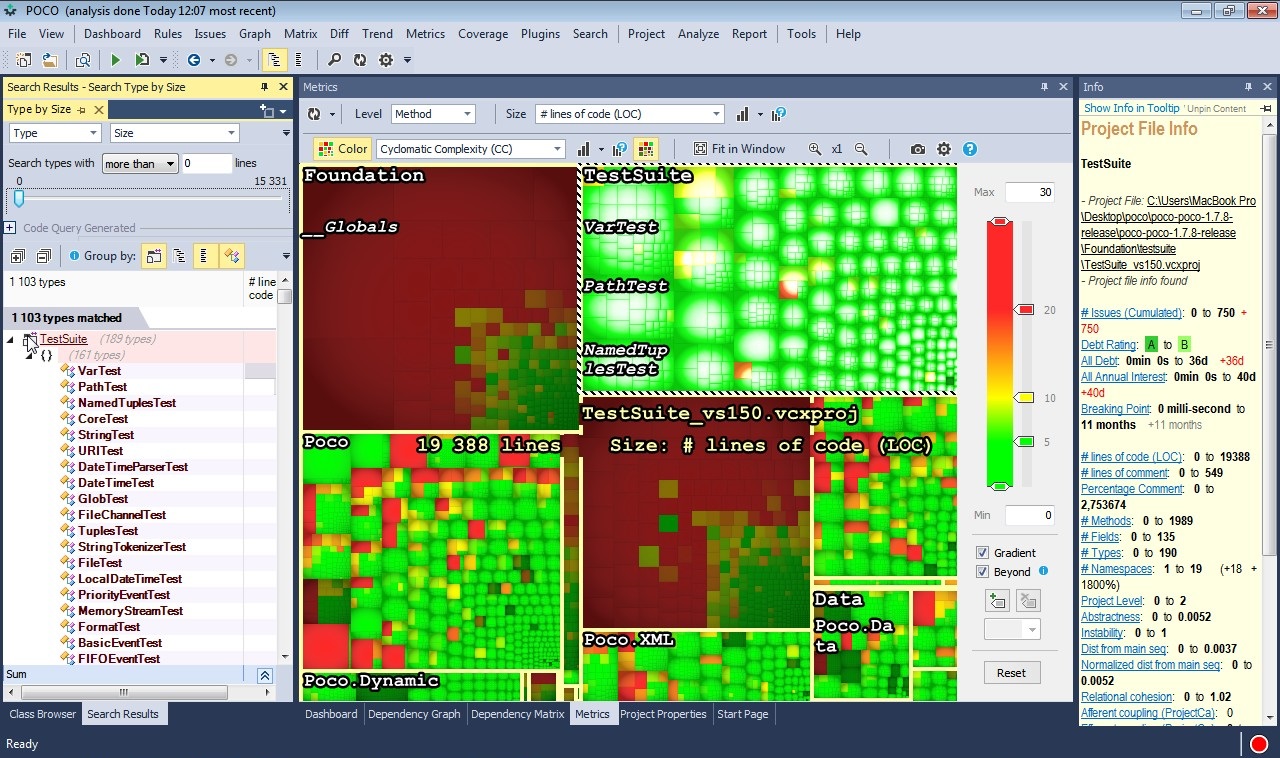
CppDepend

CppDepend is a static code analysis tool specifically designed for C++ projects.

Key features include:
- Code metrics: These metrics are presented in an easy-to-understand visual format, allowing developers to quickly see the overall health of their codebase.
- Dependency analysis: Allows developers to visualize the dependencies between different parts of their codebase.
- Code map: Allows developers to visualize the structure of their codebase as a graph. This can be helpful for understanding the relationships between parts of the code.
- Code review: Allows developers to review code changes and provide feedback before they are committed to the codebase.
Best Practices for Code Visualization
Now that we've discussed the key features and capabilities of code visualization tools, let's review some best practices that can help you get the most out of code visualization.
Use Annotations
Annotations are a powerful way to add context to your code visualizations. By annotating your code, you can provide additional information that may not be immediately apparent from the code itself. This can be particularly useful when working with complex or unfamiliar codebases.
Use Color Schemes Consistently
Consistency is key when it comes to code visualization. By using consistent color schemes, you can make your visualizations more intuitive and easier to understand. For example, you might use different shades of red to represent different levels of code complexity, or different colors to represent different types of code elements.
Provide Code Snippets
Code snippets are another useful tool for code visualization. By providing small, self-contained pieces of code, you can make your visualizations more concrete and easier to understand. This can be particularly useful when explaining complex or abstract concepts.
Real-Time Updates
Finally, real-time updates can make your code visualizations more dynamic and engaging. By using automated tools that can update visualizations in real time, you can provide a live view of your codebase, making it easier to spot trends, identify issues, and track the progress of your development efforts.
Conclusion
In conclusion, code visualization is a vital tool for modern software development, providing clear, visual representations of complex codebases. By employing diagrams, dependency graphs, UML diagrams, and C4 diagrams, developers can gain a comprehensive understanding of their software's architecture, dependencies, and workflows.
Automated code visualization tools like CodeSee offer a range of features such as automated code diagrams, code maps and dependency mapping to enhance the visualization process. These capabilities not only simplify the process of identifying and resolving coding issues but also facilitate more effective collaboration and onboarding of new team members.
Learn more about the CodeSee platform and get started with code visualization.
See Additional Guides on Key CI/CD Topics
Together with our content partners, we have authored in-depth guides on several other topics that can also be useful as you explore the world of CI/CD.
Software Deployment
Authored by Codefresh
- Software Deployment in 2023: Checklist, Strategies & Tips
- What Is Blue/Green Deployment?
- What Are Canary Deployments? Process and Visual Example
Jenkins
Authored by Codefresh
- What Is Jenkins and How Does it Work? Intro and Tutorial
- Continuous Integration with Jenkins: A Practical Guide
- Jenkins X: How It Works and Creating Your First Project
DevSecOps
Authored by Tigera
.svg)
Lorem ipsum dolor sit amet, consectetur adipiscing elit. Suspendisse varius enim in eros elementum tristique. Duis cursus, mi quis viverra ornare, eros dolor interdum nulla, ut commodo diam libero vitae erat. Aenean faucibus nibh et justo cursus id rutrum lorem imperdiet. Nunc ut sem vitae risus tristique posuere. uis cursus, mi quis viverra ornare, eros dolor interdum nulla, ut commodo diam libero vitae erat. Aenean faucibus nibh et justo cursus id rutrum lorem imperdiet. Nunc ut sem vitae risus tristique posuere.
Delete