.svg)
.png)
Datadog Distributed Tracing: Solution Overview and 3 Key Features

What Is Datadog Distributed Tracing?
Distributed tracing is a monitoring technique that tracks the flow of requests and data across various microservices and components within a distributed system. It provides end-to-end visibility into system performance, latency, and bottlenecks by capturing, analyzing, and displaying traces of individual requests as they traverse through the system.
Datadog Application Performance Monitoring (APM) is a powerful tool that enables distributed tracing for modern applications. It collects, visualizes, and analyzes traces in real-time, helping developers identify performance issues and optimize their applications. Datadog APM supports various languages, frameworks, and libraries, making it a versatile solution for monitoring complex, distributed systems.
This is part of a series of articles about distributed tracing.
In this article:
Datadog Synthetic Monitoring and Datadog APM
Datadog Synthetic Monitoring is a suite of tools designed to proactively monitor, test, and optimize applications and infrastructure components by simulating user interactions and API requests. It helps ensure that applications are functioning correctly, performant, and available to users. By combining Synthetic Monitoring with Application Performance Monitoring (APM), developers can gain comprehensive, end-to-end visibility into their applications and infrastructure, enabling them to detect and resolve issues before they impact users.
Synthetic Monitoring capabilities include locating the API endpoints with the highest traffic, identifying the root cause of issues, and optimizing the code before they impact users. By pinpointing high-traffic endpoints, developers can focus their optimization efforts and enhance application performance. Identifying the root cause of issues is essential to reduce the mean time to resolution (MTTR), ensuring a seamless user experience. Additionally, implementing cross-browser testing helps developers ensure that their applications perform consistently across different browsers and devices.
Key tools within Datadog Synthetic Monitoring and APM that facilitate these capabilities include:
- Advanced Browser Testing: This feature allows developers to create and run automated browser tests, simulating user interactions on web applications. It ensures that web applications perform as expected across various devices, browsers, and environments. By continuously monitoring the application's user journey, developers can identify and fix potential issues before they affect end-users.
- Flame Graph: This is a visualization tool within Datadog APM that displays the execution profile of an application. It shows the call stack of functions and their respective execution times, helping developers identify performance bottlenecks and optimize their code. By analyzing the Flame Graph, developers can pinpoint the root cause of performance issues and take appropriate corrective measures.
- Request Flow Map: This is a visualization tool that displays the flow of requests across services and components within a distributed system. It provides a holistic view of the dependencies, communication patterns, and performance metrics of each service, enabling developers to identify potential bottlenecks and optimize inter-service communication. By understanding the relationships between services, developers can effectively troubleshoot issues and improve overall system performance.
- Deployment Tracking: This feature allows developers to monitor and analyze the impact of code deployments on application performance. It tracks key performance indicators (KPIs) such as latency, error rates, and resource utilization before and after deployments. This helps developers identify regressions and ensure that new features or updates do not negatively affect application performance. By analyzing the impact of deployments, developers can optimize their release processes and maintain a high level of application quality.
By integrating Synthetic Monitoring with APM, Datadog provides a comprehensive monitoring solution that combines proactive and reactive approaches to ensure optimal application performance. Synthetic Monitoring simulates user interactions and API requests to detect potential issues, while APM captures, analyzes, and visualizes real-time performance data from applications and their underlying infrastructure. This combined approach enhances end-to-end visibility by providing a complete picture of application performance from the user's perspective and the underlying system components.
Distributed Tracing with Datadog APM: 3 Key Features
Datadog Distributed Tracing offers control over distributed traces through granular ingestion controls and tag-based retention filters. Ingestion controls enable teams to modify the trace volume and sampling rate for each service based on specific criteria, such as request throughput and the service's importance to an application. This approach allows businesses to concentrate on the most critical services and transactions while maintaining budgetary constraints.
Here are some of the main features of Datadog Application Performance Monitoring, as they relate to distributed tracing.
Live Search
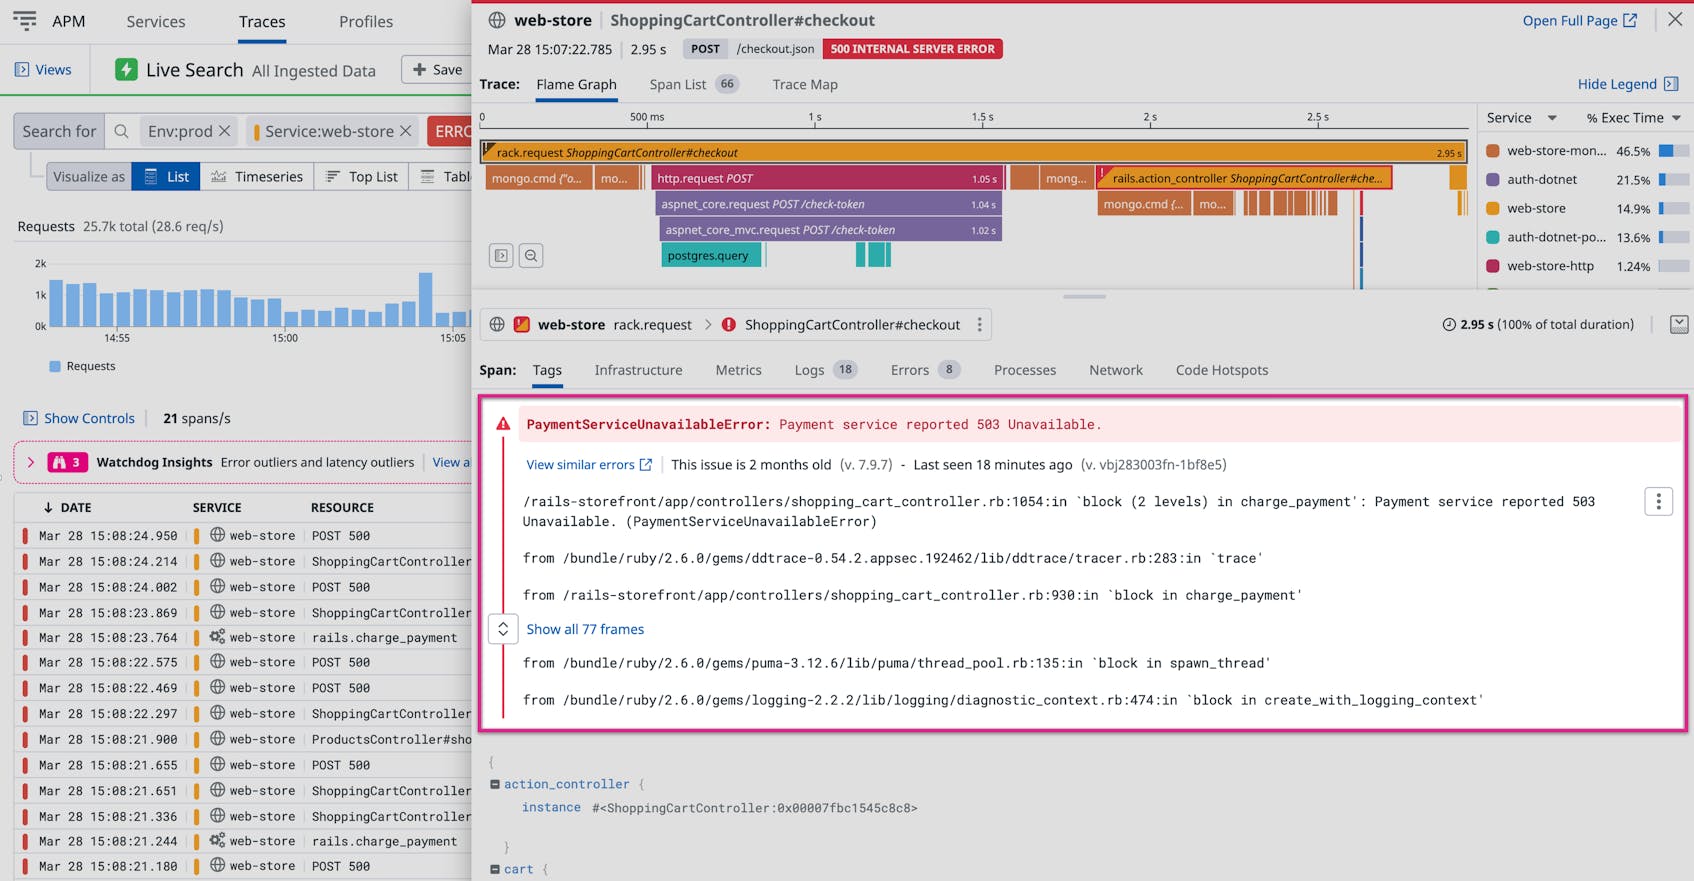
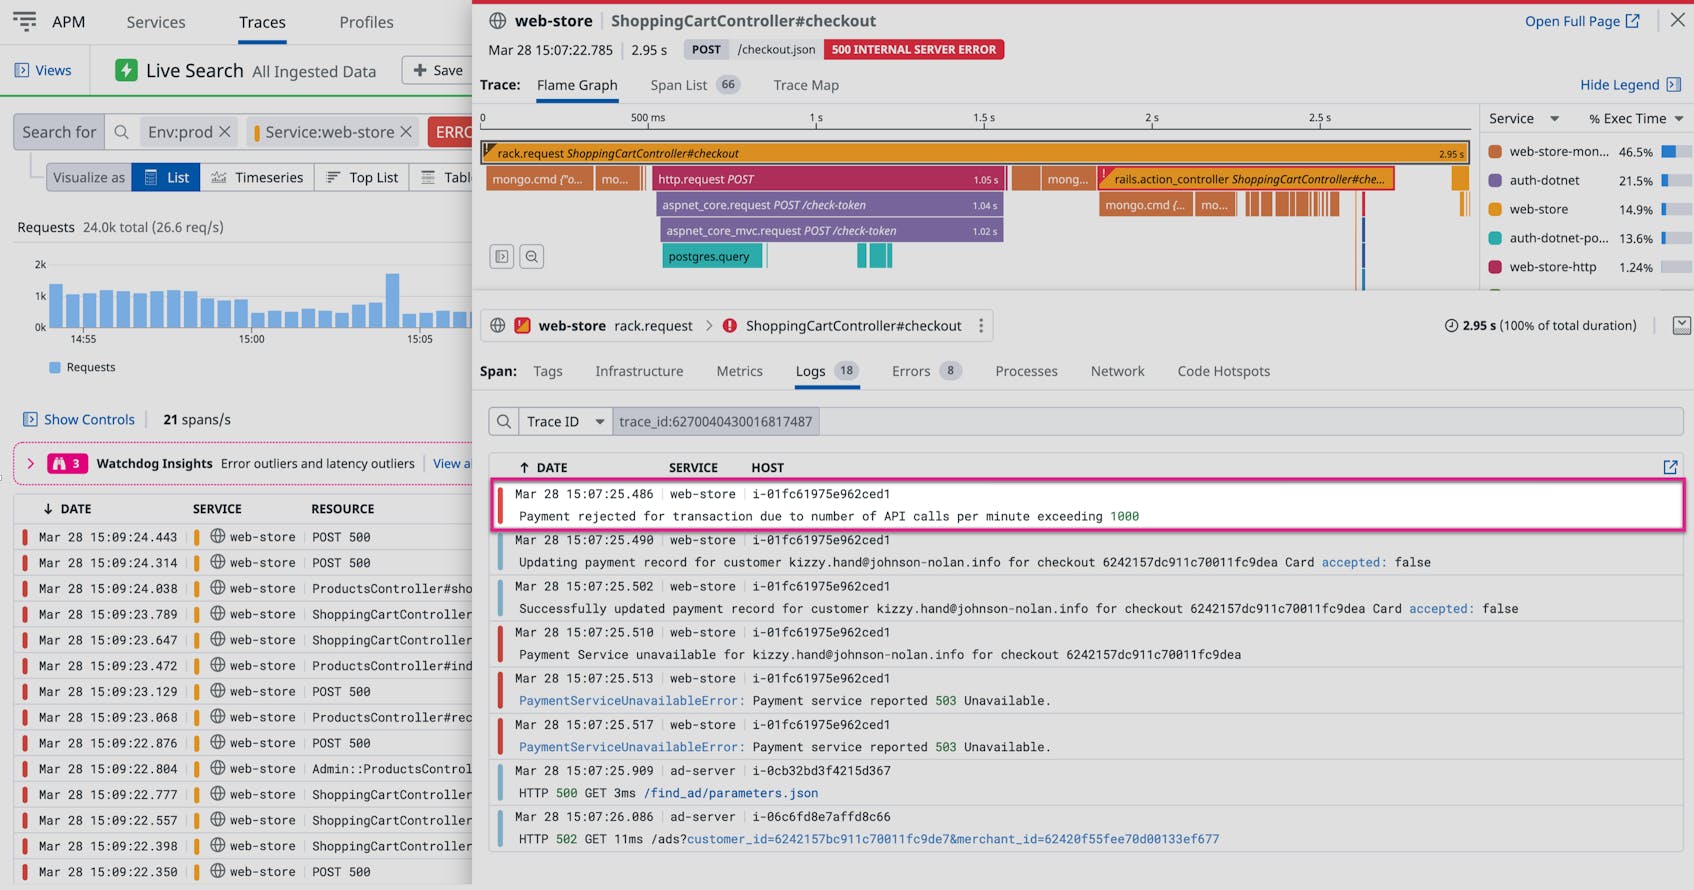
Live Search allows developers to search and analyze real-time trace data, enabling them to pinpoint the source of issues reported by customers quickly and effectively. By providing the ability to filter and query traces based on tags, services, and other attributes, Live Search empowers developers to efficiently identify and investigate the root cause of performance problems or errors experienced by end-users.
When customers report issues, developers can use Live Search to locate traces associated with the specific problem. By examining these traces, they can gain insights into the service calls, dependencies, and execution times that could be contributing to the issue. This granular analysis helps developers identify the exact component or service responsible for the problem, facilitating faster resolution and improved customer satisfaction.
The flamegraph is a visualization tool used to investigate traces and identify performance bottlenecks within an application. It displays the call stack of functions along with their execution times, providing a visual representation of how resources are consumed during the execution of a request.

By analyzing the flamegraph, developers can pinpoint slow-performing or resource-intensive functions that may be causing issues reported by customers. This allows them to optimize the code, enhance application performance, and ultimately deliver a better user experience.

Live Analytics
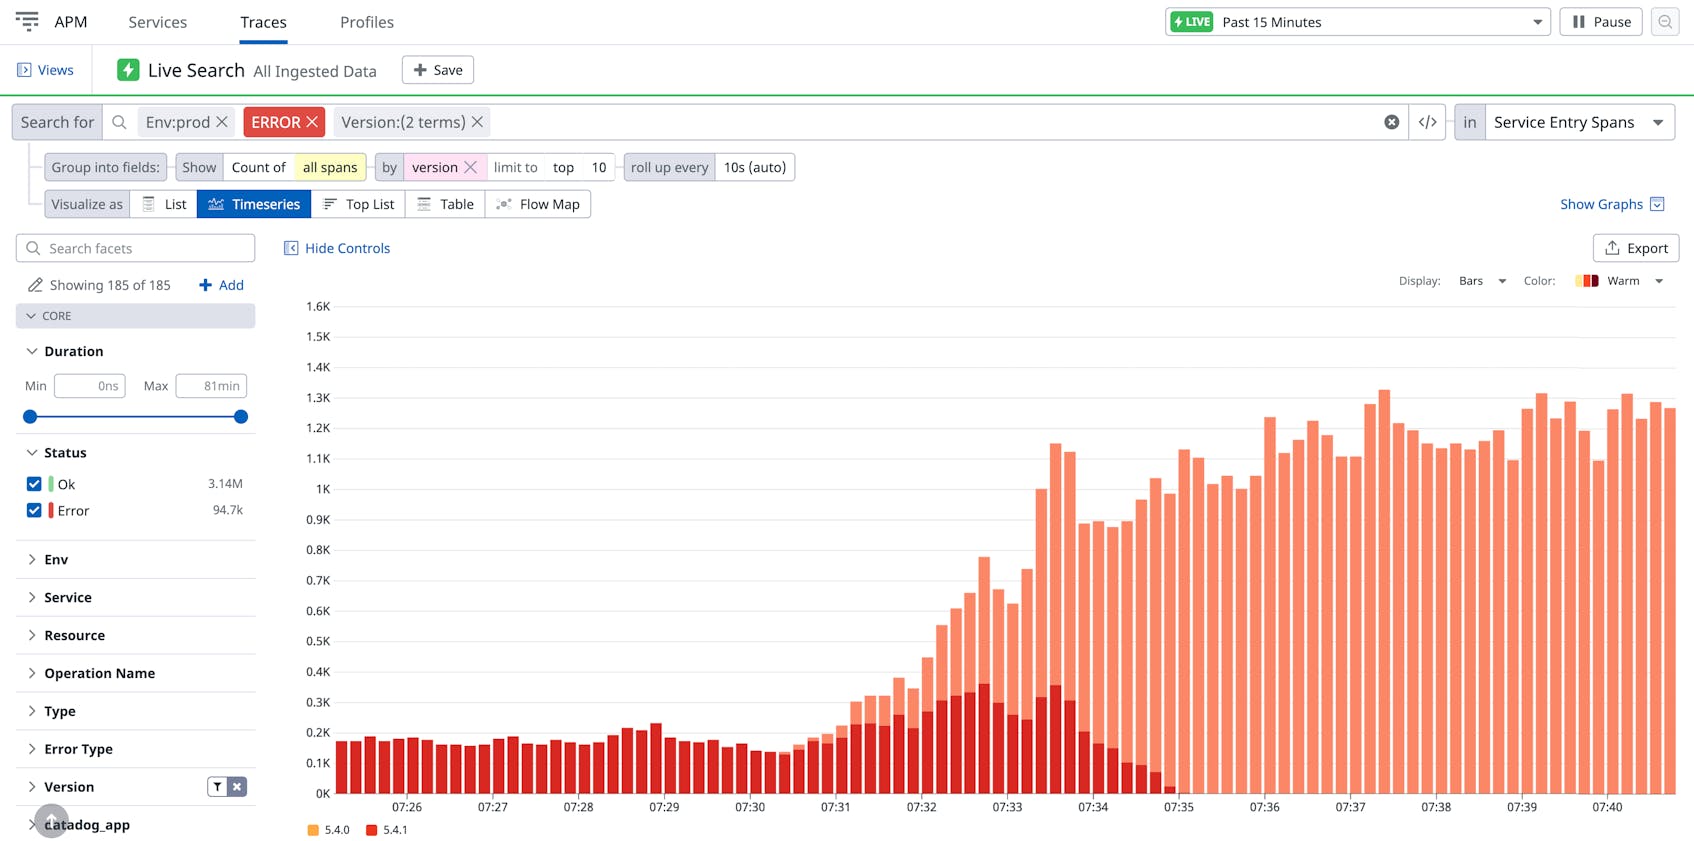
Live Analytics is a feature within Datadog APM that allows developers to explore and analyze real-time application performance data, helping them to determine the scope of reported issues. By aggregating, filtering, and visualizing trace data based on various attributes, Live Analytics enables developers to identify patterns, trends, and anomalies that may contribute to the problem at hand.
Live Analytics provides graphs that show the error count over the most recent 15-minute period. For example, the following graph shows that two versions have recently experienced an increase in their error counts. The second version has a more extreme spike when being rolled to production.

Retention Filters
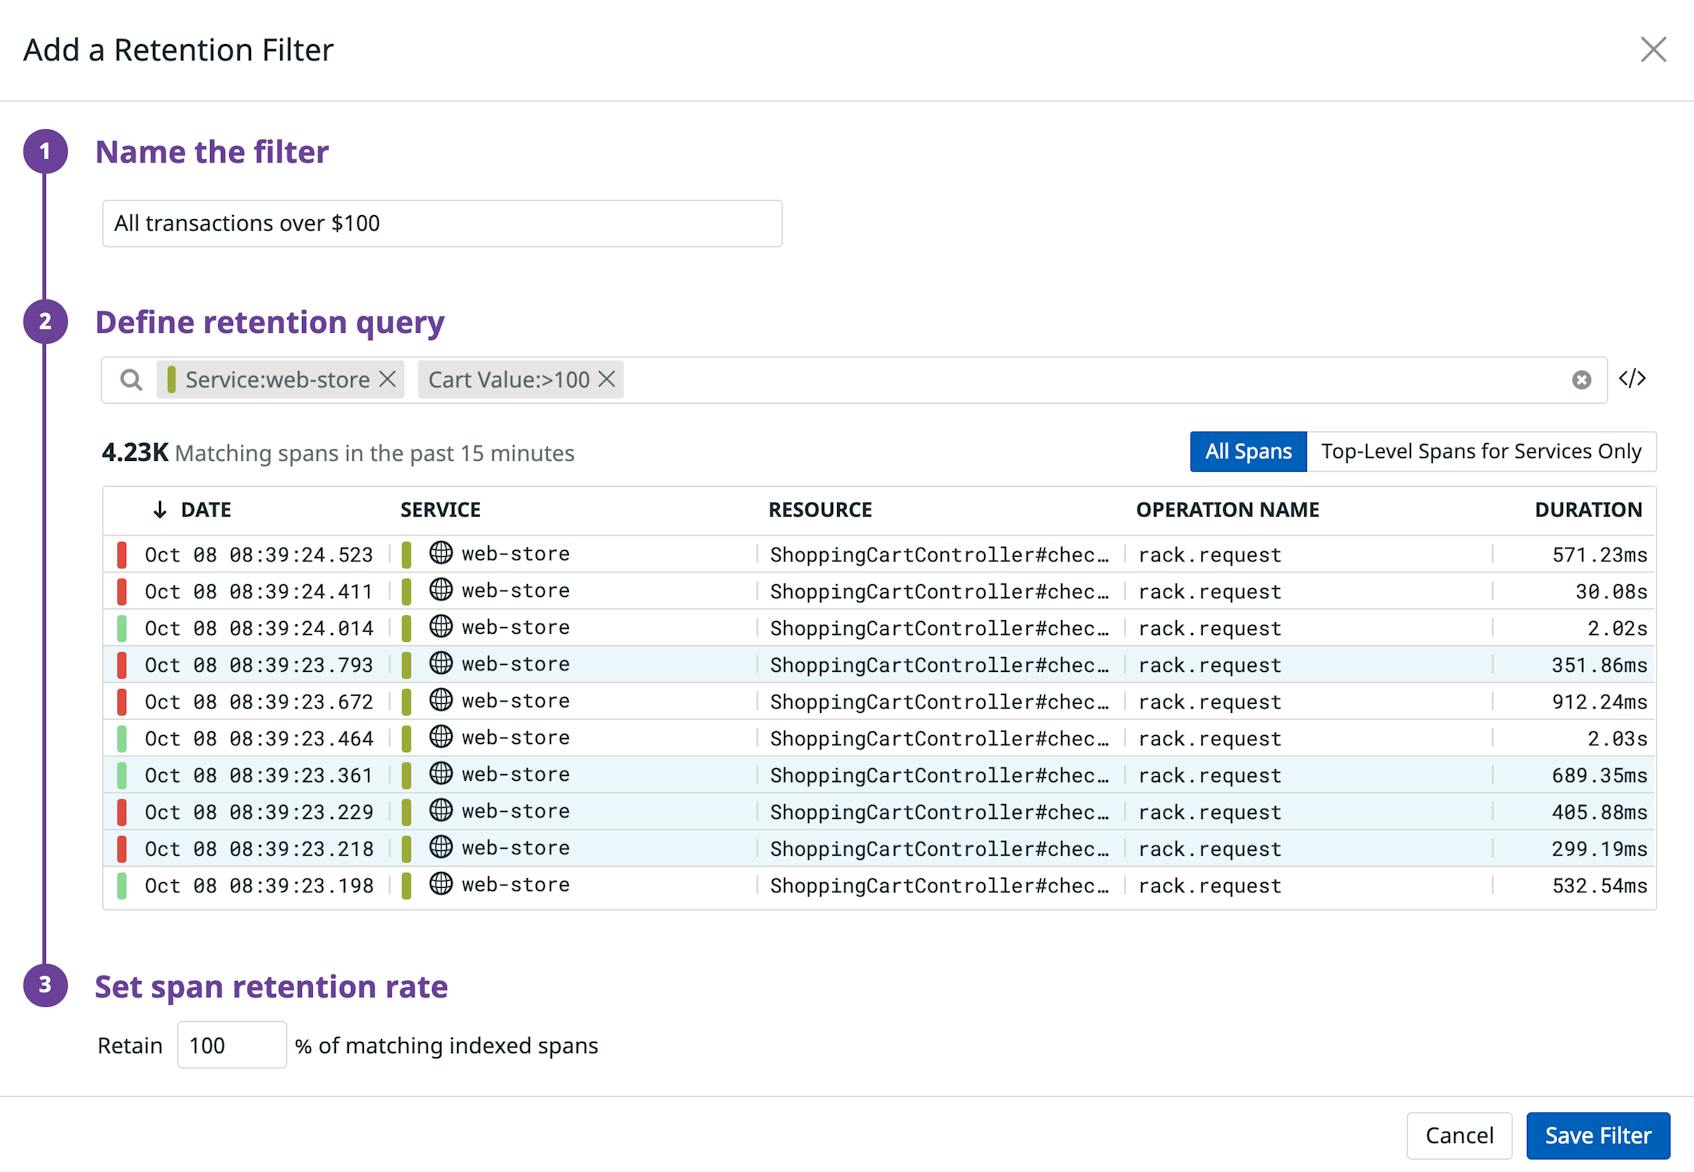
Retention filters are a feature within Datadog APM that allows businesses to selectively retain important traces based on specific tags. These filters enable organizations to manage their tracing data more efficiently by preserving valuable traces while discarding less relevant ones, optimizing storage and reducing costs.
Tail-based decision making is a technique employed by retention filters to evaluate traces at the end of their processing pipeline. This approach allows for more accurate filtering, as it takes into account the complete context of a trace, including any errors or performance issues that may have occurred during its execution.

By utilizing retention filters, businesses can retain traces that provide valuable business context, such as those related to critical user transactions, high-value customers, or specific application features. This ensures that essential information is preserved for analysis and troubleshooting, while less important data is discarded.
Related Content: Read our guides on OpenTelemetry, OpenTelemetry architecture, & distributed tracing tools.
.svg)
Lorem ipsum dolor sit amet, consectetur adipiscing elit. Suspendisse varius enim in eros elementum tristique. Duis cursus, mi quis viverra ornare, eros dolor interdum nulla, ut commodo diam libero vitae erat. Aenean faucibus nibh et justo cursus id rutrum lorem imperdiet. Nunc ut sem vitae risus tristique posuere. uis cursus, mi quis viverra ornare, eros dolor interdum nulla, ut commodo diam libero vitae erat. Aenean faucibus nibh et justo cursus id rutrum lorem imperdiet. Nunc ut sem vitae risus tristique posuere.
Delete